

OPEN SPACE was the highest priority of this community in the planning of its 8-acre park along with the civic and community facilities that were to go with it. These simple diagrams demonstrated how the master plan would convert one acre of park space into five acres. It was a simple, powerful and effective message that delivered on what the community most wanted and engendered the confidence that they would get it. (West Hollywood Park, West Hollywood, CA)
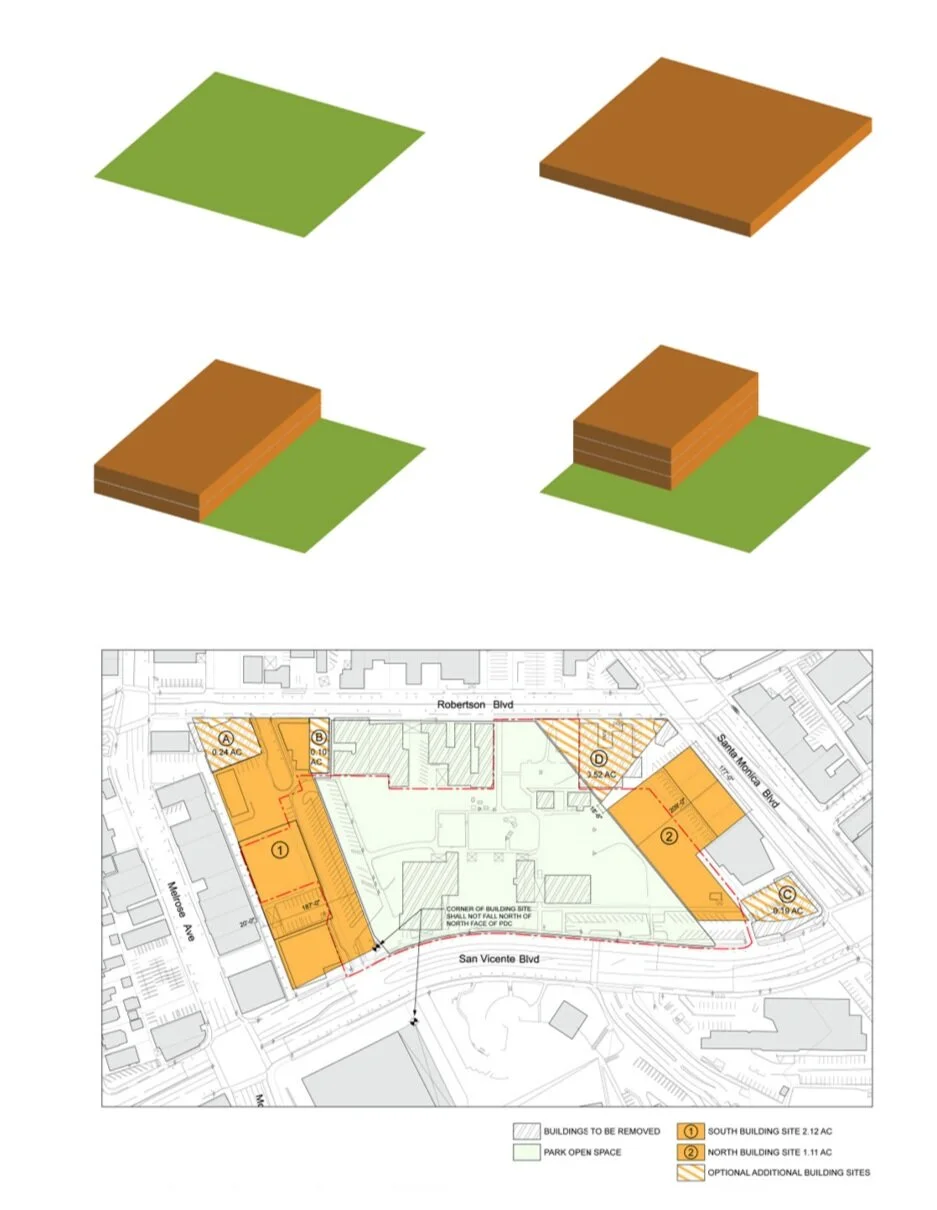
THE REGULATING PLAN gives guidance on where and where not to build buildings. The “floor area ratio” or FAR of a site compares the amount of building floor area to the area of the site. How floor area distributes horizontally and vertically on the site is the more important consideration when the creation and preservation of open space is a priority. (West Hollywood Park, West Hollywood, CA)

VERTICAL INTEGRATION at the edges of the park of one-story facilities that Los Angeles County (from whom the newly formed city of West Hollywood had inherited them in 1984) had spread throughout this park in the 1950s and 60s was how the master plan transformed the site into to a place that most Americans would recognize as a park.
As architects we traffic mostly in diagrams—two dimensional descriptions of characteristics of a building or a built environment that you will not necessarily see but which will shape your experience of it. Diagrams have been with us for millennia and architects have employed them for centuries (plans, sections, elevations) but for most of us they are a relatively newly ubiquitous. Today we are exposed to some kind of diagram almost every day in the media and elsewhere-visual representations of information meant to convey at-a-glance a picture of a set of facts, some kind of reality-- that we don’t necessarily see but which influences how we see or think about the world around us.

DIAGRAMS have been with us in various forms ranging from entirely pictorial to entirely graphic since consciousness, sometimes depicting difficult to comprehend, ineffable and invisible realities. Two shown here depict no less than the cosmic foundations of the creation of the world and us. (Creation, Sistine Chapel, Michelangelo; Tree of Life, 3,500-year-old representation of the spiritual structure of all of reality)

TIME is experienced in our world through nested sequences of events some of which are days, seasons and years which are related to the movement and position of the sun in the sky. We kept track of time loosely with sun dials until the 18th century when with advancements in mathematics and mechanics we got clocks--diagrams that both simplified and made accessible to everyone an agreed upon understanding of the passage of time in rational increments.
The most common are pie charts (relative quantities of parts in relation to other parts-- useful, for example, in demographics) bar charts (same thing, different format, sometimes with the element of time, often used in economics) organization charts (hierarchies and relationships among people) and flow charts (allocations of resources over geography or time, genealogy such as a family tree, binary decision making such as writing code in computational algorithmic languages). There are Venn diagrams (similarities and differences among groups or categories) graphs (change and rates of change over time) and spreadsheets (numerical relationships such as payables and receivables).

VENN DIAGRAMS suggest in a snapshot what things or phenomena have in common and what they don’t. It can be as simple as understanding the difference between whales and fish or as sophisticated as how to craft economic, social and environmental policies to reshape our societies in equitable and sustainable ways.

PIE CHARTS show who shares how much of the pie. How does the population of the US distribute by state, what’s the make-up by ethnicity of a state or a city, how much of the total wealth of a nation or state is owned by upper, middle and lower classes?

BAR CHARTS show quantities usually comparing a limited number of sets and usually over time—how a pandemic grows and distributes among groups, how profits in various parts of a company compare with each other and over time, etc.
These are diagrams that are useful for statisticians, accountants, journalists, economists, scientists, environmentalists, geographers and demographers, elected officials and even those kinds of planners who think of “planning” in mostly social or economic terms. In the practice of architecture, though, there’s not a whole lot that can be explored or explained by way of a pie chart or bar chart or any of the rest of those kinds of diagrams.

FLOW CHARTS show how resources distribute across geography and time, how decisions are made in a large organization, or how a thought process logically unfolds.

CODING put flow charts front and center in the 21st century popular imagination. We’re all familiar with the brilliant coder scrawling out computer code on a white board.

THE BUBBLE DIAGRAM emerged in the1940s and 50s of the last century. It is a kind of flow chart meant to depict how functional relationships in a building or built environment are supposed to work.
Last century architects invented and (especially during the hyper-functional post-war mid-century years) obsessively employed a kind of flow chart called the “bubble diagram.” It claimed to be a value-free or unbiased tool with which to understand and show relationships of component parts of a building without resorting to old mind-sets or traditional habits. It turned out to show mostly what was already obvious. Worse still it proved inhibitive, a way to avoid composition altogether and it created its own habitual oddities. Since a lobby or living room necessarily relates or “flows” to every other room you inevitably end up with a star, spoked wheel or H-shaped composition—every building a panopticon.

GIAMBATTISTA NOLLI invented a kind of diagram now known as “figure ground” in which he mapped out all the public spaces in the city including those inside or within buildings as well as those outside of buildings.

CAMILLO SITTE in the 19th century used the figure ground as a planning tool employing buildings as material with which to create what he called “civic spaces”

FIGURE GROUND DIAGRAMS show at-a-glance how different cities differ by their building patterns. These diagrams speak volumes and with efficiency of means about the characteristics of building patterns of cities and how different they are (Paris above, Los Angeles, below)
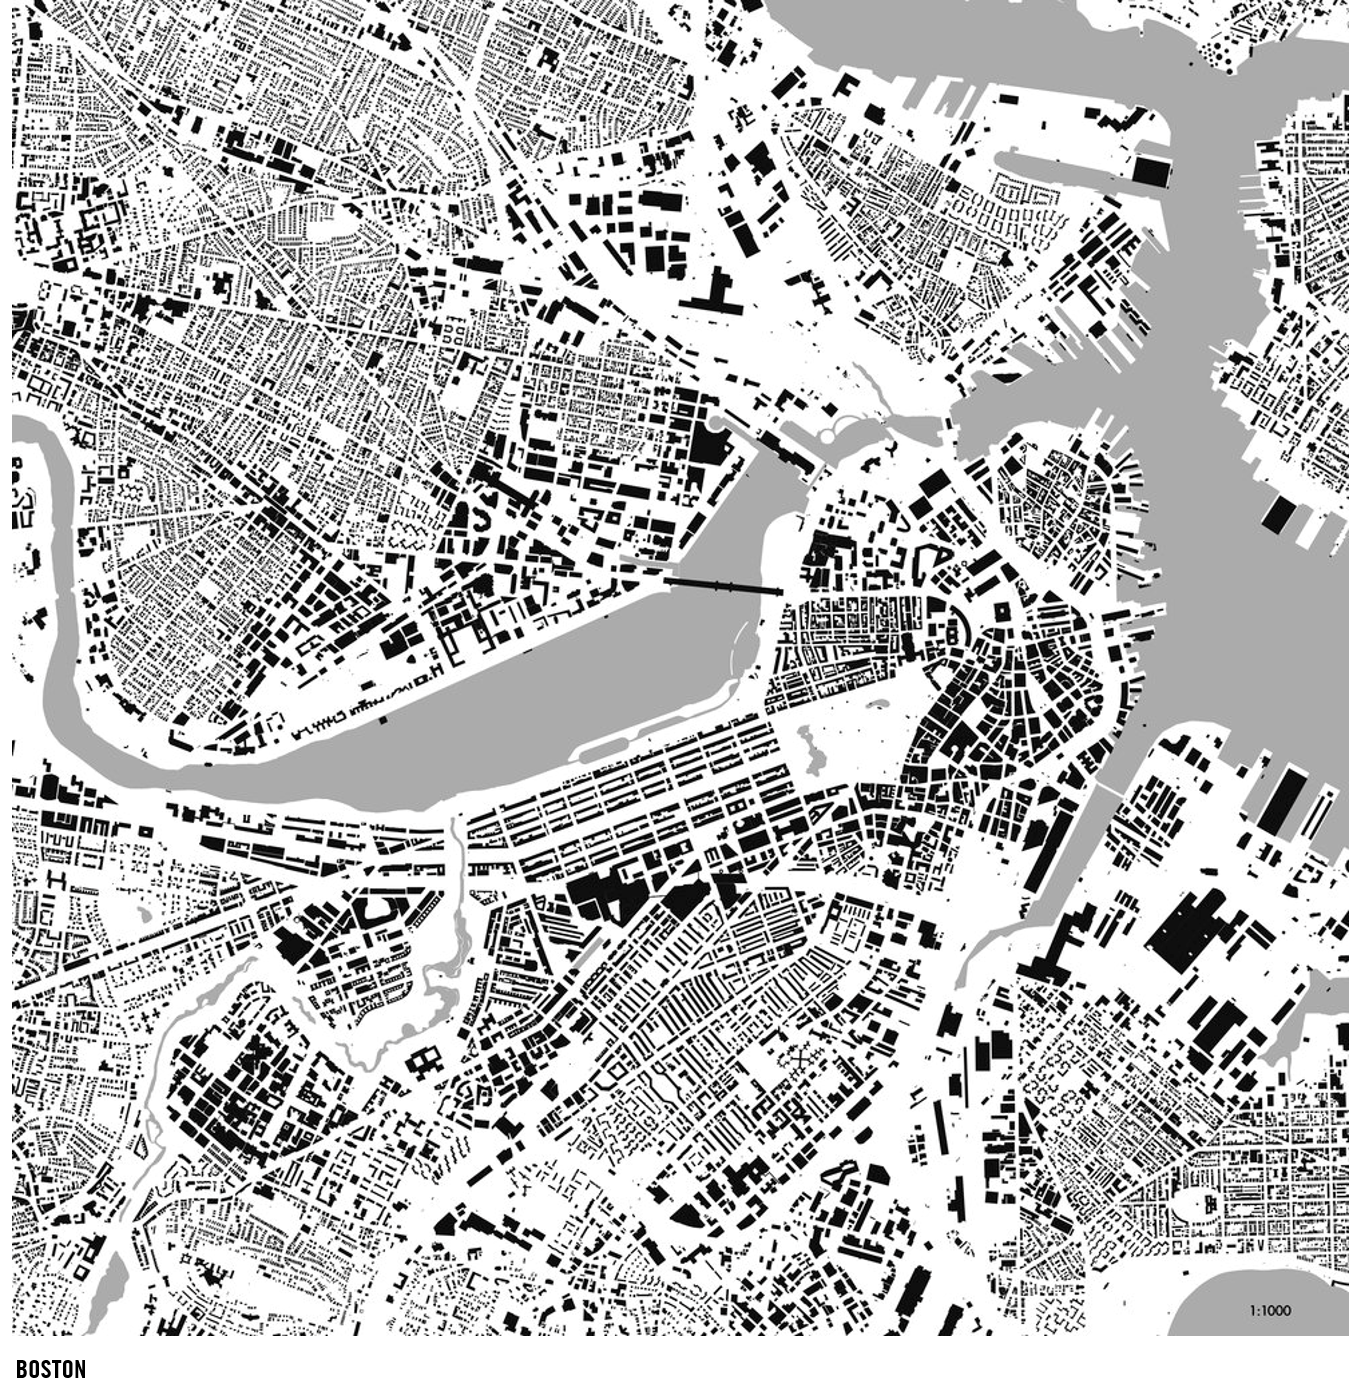
EVOLVING BUILDING PATTERNS of a city can be detected in a figure ground diagram such as this one of Boston MA where one sees how the city changed as it expanded outward from the 17th through 21st centuries.
Perhaps the most famous diagram ever invented was an 18th century map of Rome by Giambattista Nolli. It’s not your typical city map (a different kind of diagram altogether) because he had something different in mind: an idea to convey. He wanted to map not streets and buildings but rather public spaces distinguished from private spaces. Think of it like this: if in the middle of the night you walked the city with a flashlight (or I suppose a candelabra) down streets and into publicly accessible spaces (lobbies, loggias, churches, city halls, courthouses, courtyards and gardens) what would you see? Everything that lights up goes white on Nolli’s map and shows as public space, everything that doesn’t goes black and shows as private space.

PHILOSOPHIES OF SPACE PLANNING show how one floor eight floors in this building originally built in the 1960s will be transformed in the 2020s from a “closed” environment to an open one. (UCLA School of Public Health)
This is what today we call a “figure ground” diagram. It is a method with which to see buildings not as free agents in a neutral field, but rather material with which to shape the public realm. It too has its biases and inhibitions favoring composition in two dimensions avoiding three dimensions and what buildings and built environments look like. As with the bubble diagram the figure ground diagram is driven by a point of view. The bubble diagram seeks to map functional relationships, the figure ground spatial relationships.

ONE SIMPLE MOVE transformed this old school cafeteria on a university campus from an underutilized food court to one full of variety and life. The three diagrams were, more than the visualizations that accompanied them, what convinced us and the university of the both the simplicity and possibility of such a strategy. (UCLA Hedrick Study)
Diagrams are the tools with which to extract and highlight one aspect of an otherwise complex set of relationships of a building or built environment in order to better understand it and explain it to others. Useful diagrams within the practice of architecture nearly always have a pictorial, albeit still abstract, aspect to them that, however remotely, relate back to some aspect of physical reality (unlike a pie, bar or flow chart) even as they highlight properties not directly seen in the apprehension and experience of a built environment.

ANALYSIS of this 300,000 SF, 1960s era research library on a major university campus shows how ¾ of the building is occupied by everything other than space for students and researchers (collections, storage, staff work space, etc.) The library of the 21st century will reverse this ratio of “back-of-house” space, shown in gray, and “user” space shown in blue. (UCLA Young Research Library)
It is with the specific kinds of diagrams we choose to depict for ourselves and for others that we are already deciding what’s important to us and what we think is important to them. The choice of what to draw, what to accentuate and what to leave out in order to make accessible that which is meant to be conveyed is an art. Our choices are driven by the desire to connect to those other than ourselves. We want those we serve to do the right thing, that which in our dispassionate estimation is the right thing for them, to understand it and have the confidence to act upon it. This requires that we as architects cultivate an understanding and feeling for what is important to others, or in a word, empathy.
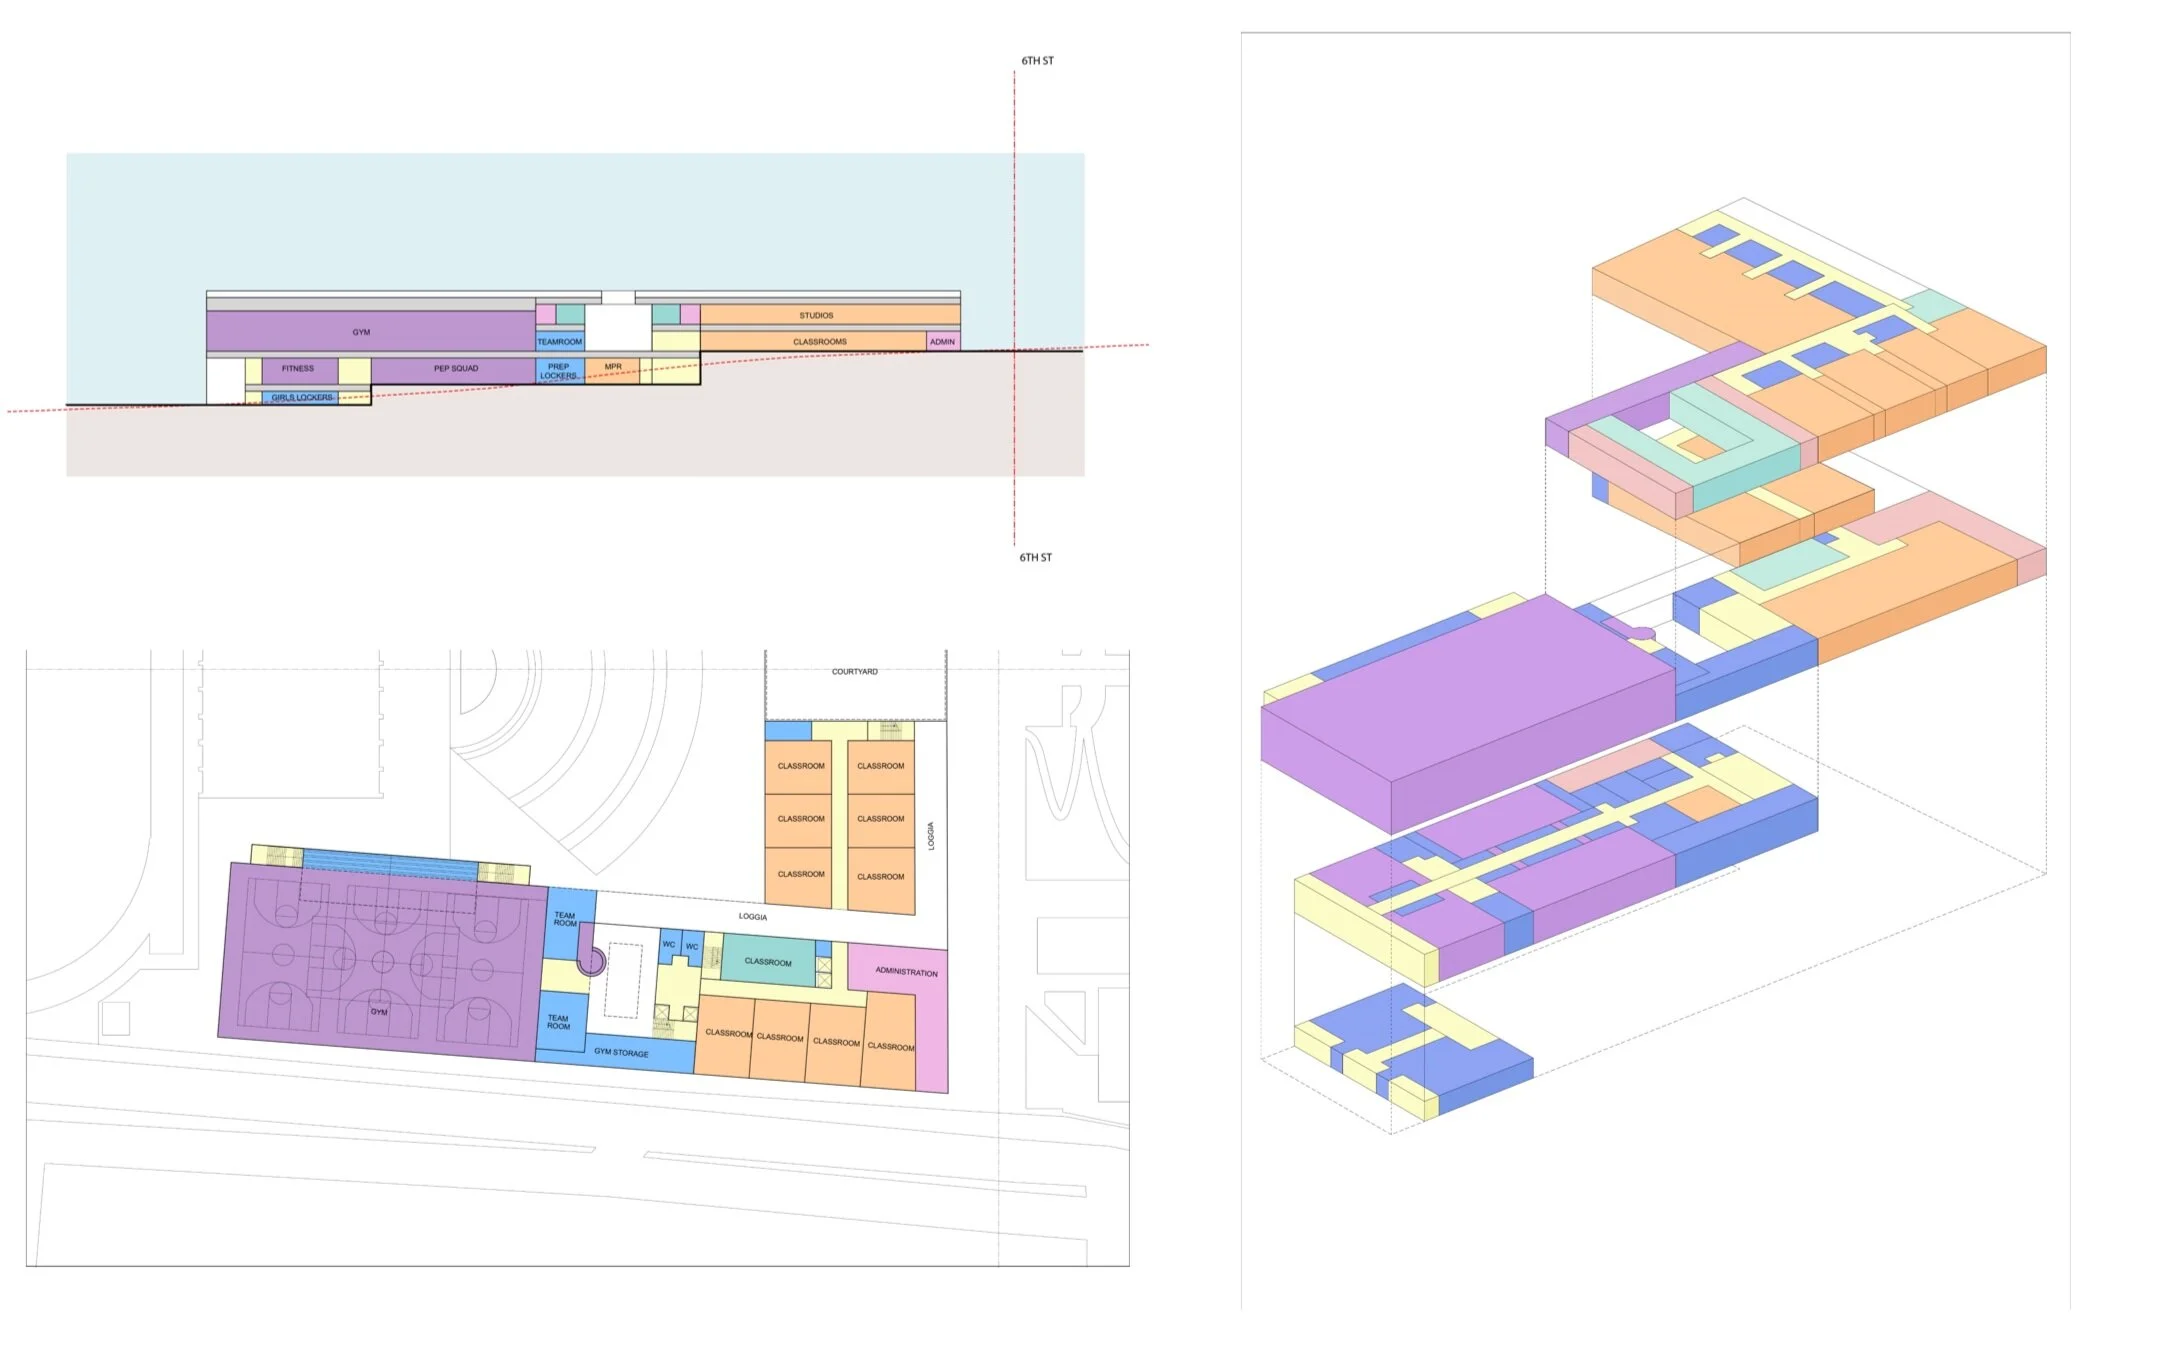
BLOCK AND STACK diagrams show relationships of component parts of this complex school building in both the horizontal and vertical dimensions. These diagrams improve upon the old school bubble diagram in that they deal with scale, distribution, adjacency and circulation as well as functional relationships all within the context of the building’s site. (Santa Monica Malibu Unified School District Santa Monica High School)

SIMPLE 3-D AERIAL VIEWS of strategies for the redevelopment of this school in Santa Monica, CA help to show the district and the school how much second floor area would be required to accommodate projections of future student population and how that 2nd floor would be best distributed on campus. The diagrams have been a key decision-making tool in the planning process. (Santa Monica Malibu Unified School District Will Rogers Elementary School)